


RESEARCH LINE
Novel Imaging Biomarkers

Advancing Precision Medicine through Imaging, Lipidomics, and AI
Our research group investigates the role of cellular membranes in health and disease, aiming to develop novel biomarkers and therapeutic strategies for precision medicine. We utilize advanced imaging techniques, lipidomics, and artificial intelligence to study membrane fluidity, lipid composition, oxidative stress, and autophagy. Our goal is to translate these findings into clinically relevant applications.
Featured Research Areas:
The Cellular Membrane as the Central Regulator of Life and Disease
Redox imaging and oxidative stress in cells
Autophagy, cellular morphodynamics and intracellular signaling
Membrane Fluidity and Lipid Modulation
in Red Blood Cells:
From Physics to Clinical Biomarkers
Red blood cells (RBCs) are traditionally known for their role in gas transport, but recent advances have positioned them as dynamic reporters of metabolic health. Their plasma membrane, composed of a lipid bilayer with embedded proteins, is sensitive to oxidative stress, fatty acid composition, and pathological conditions—especially in diabetes.
Lipid-Driven Modulation of Membrane Fluidity
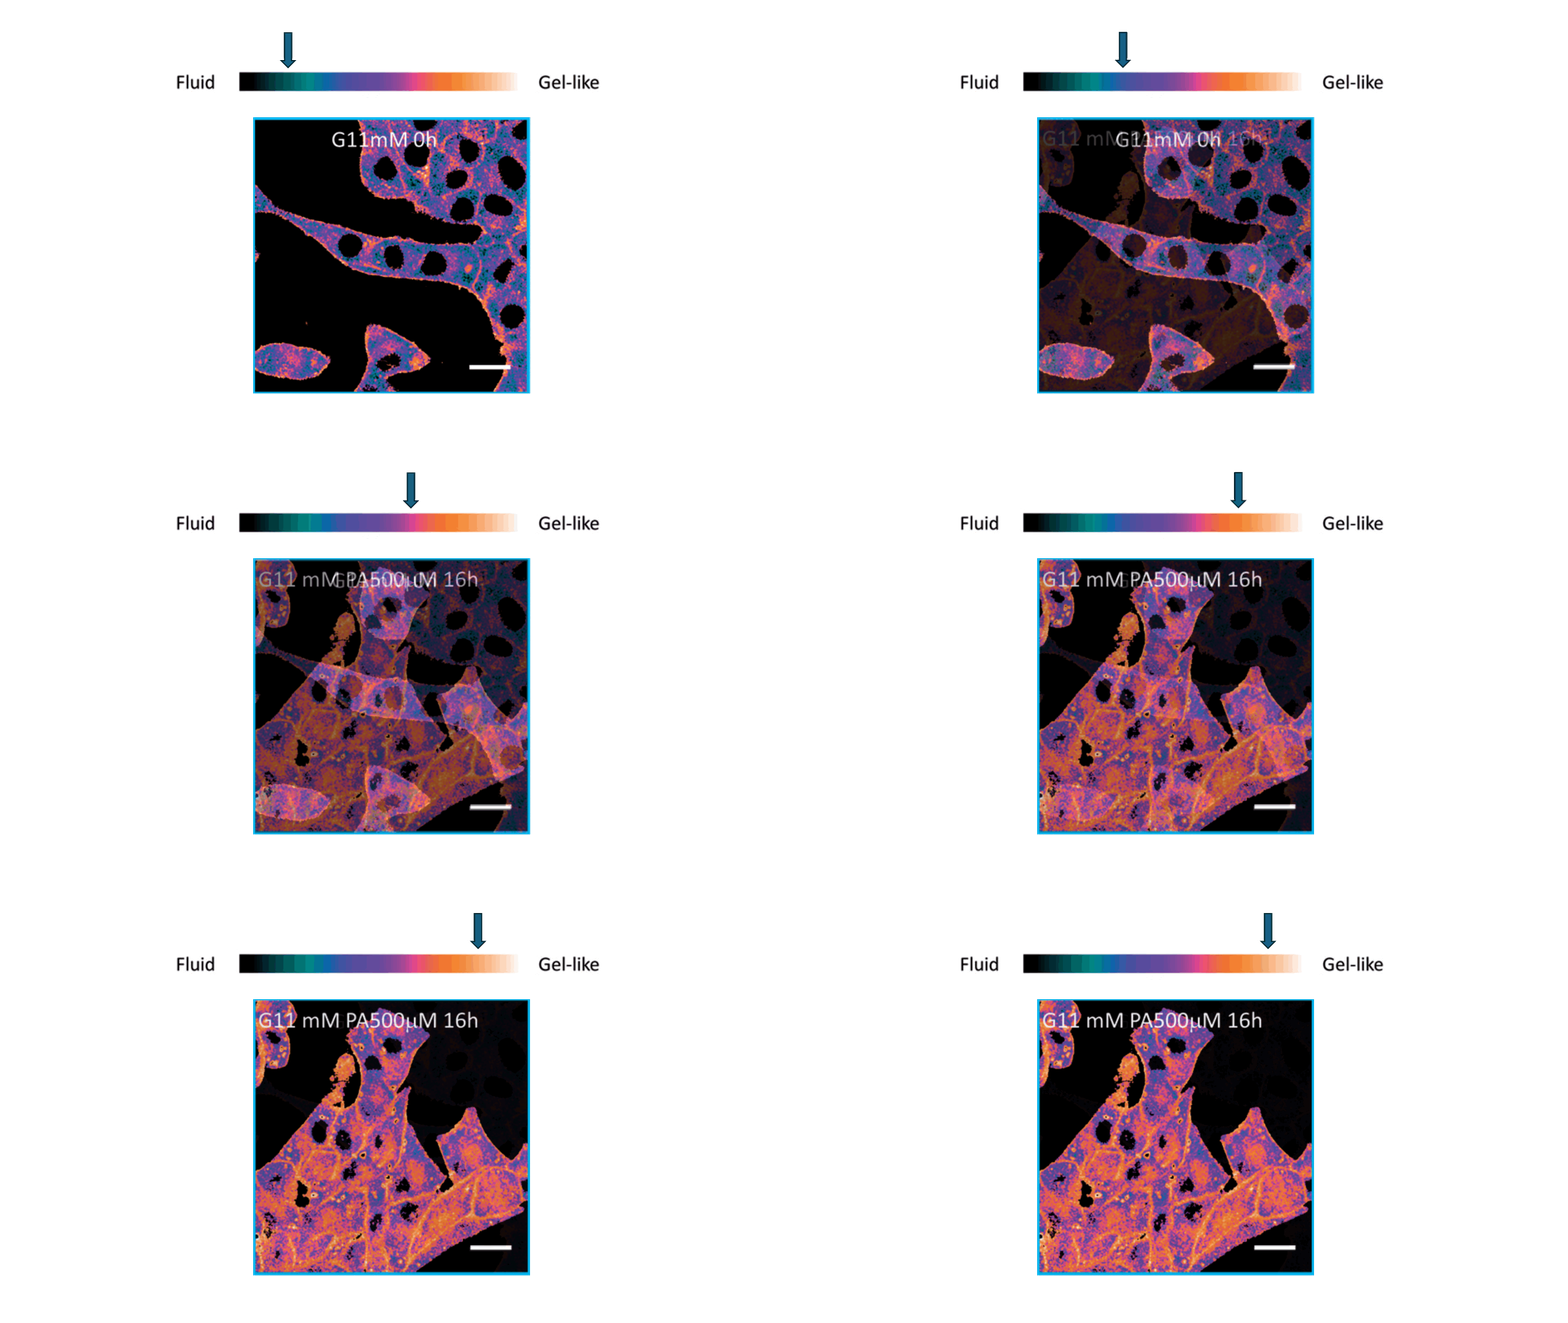
Membrane fluidity is determined largely by its lipid composition, particularly the ratio of saturated to unsaturated fatty acids and cholesterol content. Alterations in this composition—due to diet, inflammation, or metabolic disorders—directly affect the biophysical behavior of membranes. In our study we demonstrated how fatty acid remodeling influences membrane properties in a range of cell types. These changes can:
-
Modify the liquid-crystalline phase of membranesAlter the spatial organization of lipid rafts
-
Affect key signaling processes and protein-lipid interactions
This lipid-centric perspective forms the biophysical foundation for our translational work on RBC membranes.
Biophysics Meets Clinical Diagnostics
We applied this understanding to investigate erythrocyte membrane fluidity in patients with metabolic diseases.
Together, these works define a new diagnostic paradigm: erythrocyte membrane fluidity, shaped by underlying lipid dynamics, acts as a sensitive and quantifiable marker of metabolic and vascular status.
Most recently we extended the approach to pregnancy: in gestational diabetes, label-free autofluorescence imaging of red blood cells captures oxidative stress beyond membrane fluidity, adding an independent readout to the very same single-cell measurement (Riente, A. et al., Microscopy and Microanalysis 2026, 32, ozag016. DOI: 10.1093/mam/ozag016).
Redox Signaling and Oxidative Stress:
A Functional Layer of Membrane Biology
Oxidative stress is a key driver of cellular dysfunction and disease progression, especially in metabolic and neurodegenerative conditions. Despite its importance, quantifying redox imbalance in living cells with high spatial and temporal resolution has remained a major challenge.
Our research group has addressed this by developing real-time, quantitative imaging methods that allow intracellular mapping of oxidative stress at subcellular resolution—paving the way for redox biology to be incorporated into diagnostic frameworks.
Cochlea
We studied the outer hair cells of the cochlea exposed to noise-induced stress. Here, we observed how redox imbalance:
-
Triggers lipid peroxidation
-
Reduces membrane fluidity
-
Ultimately leads to functional and structural damage
These findings represent a direct link between oxidative stress, membrane biophysics, and cellular degeneration—especially in sensory systems highly vulnerable to redox perturbations.
Tap or click the images below for more information

Longitudinal distribution of NAD(P)H and fluidity in OHC cells

Time-course response of cochlear outer hair cells to acoustic stress

Zoom-in on local damage in outer hair cells (OHCs)

Mechanistic model and quantitative validation
We applied FRIM to assess the glutathione redox state in live cells. By using ratiometric probes like monochlorobimane (MCB) and roGFP-based sensors, we quantified:
The GSH/GSSG ratio at organelle level
Spatial gradients in oxidative stress responses
Temporal dynamics under stress-inducing stimuli
This method allowed us to generate "redox maps", offering insight into how different cellular compartments experience oxidative imbalance differently—something not possible with bulk biochemical assays.
Autophagy, cellular morphodynamics
and intracellular signaling
Cells are not static entities. Their shape, internal organization, and dynamic processes are constantly adapting in response to external and internal cues. This plasticity is essential for survival, stress response, and metabolic regulation. Our research explores how to quantify these intracellular dynamics, with a particular focus on autophagic flux, morphodynamics, and their links to cellular signaling.
Quantifying Autophagy in Real Time
Autophagy is a fundamental catabolic process where cells recycle damaged components and respond to metabolic stress. Traditional methods to monitor it (e.g., LC3 immunostaining) often lack temporal resolution and
quantitativeness.

We developed a confocal pH-sensitive imaging protocol to quantitatively monitor autophagic flux: We used fluorescent probes that change emission based on pH, enabling us to distinguish between autophagosomes (neutral pH) and autolysosomes (acidic pH). The technique allows live tracking of autophagic intermediates over time, capturing dynamic transitions.
Reveal the pH inside autophagic organelles by pointing over each cell image.
Blue/Purple areas → acidic vesicles
Yellow/Red areas → less acidic or neutral vesicles


Control: Cells under normal conditions
Homogeneous signal, few acidic structures — typical of basal autophagy.


Starvation: Cells deprived of nutrients to trigger autophagy
Strong activation of autophagy, with many acidic structures.


Rapamycin: Cells treated with rapamycin, a drug that promotes autophagy
Increased number of acidic vesicles (violet), indicating autolysosome formation and enhanced autophagic flux


Combined nutrient deprivation and rapamycin treatment
Slightly less intense, resembling control more closely.


Chloroquine: An inhibitor that blocks the fusion between autophagosomes and lysosomes
Accumulation of neutral vesicles — autophagy is blocked


3-Methyladenine: A compound that prevents the formation of new autophagosomes
Few vesicles overall — early autophagy is inhibited.
Stochastic Morphodynamics and Signal Integration
We introduced a stochastic analysis framework that links cellular morphodynamics (changes in shape and edge fluctuation) with biochemical signaling events. Using time-lapse fluorescent imaging and edge-tracking algorithms, we modeled how the probability distribution of shape fluctuations changes under different stimuli.We demonstrated that morphological variability correlates with intracellular signaling noise, suggesting that shape is both a readout and regulator of signaling dynamics.
📊 Key impact: This approach offers a quantitative link between structure and signaling, moving beyond static imaging to capture cell behavior as a dynamic system.
Redox Dynamics and Membrane Signaling
In [📄 Science Signaling, 2008 – scisignal.143pl3.pdf], we detailed a protocol for quantifying redox changes in membranes using live-cell microscopy. These shifts in redox state are early indicators of:
Oxidative damage
Mitochondrial dysfunction
Signal transduction abnormalities
By integrating these measures with morphodynamic and pH imaging, we build a multi-parametric map of cell state transitions.
What the interactive panels show
Cellular redox mapping via autofluorescence imaging
Panel A, pseudocolour redox map. This image displays the intracellular redox state of a single cell, measured through the endogenous autofluorescence of NAD(P)H and FAD. Red indicates reduced regions, with high NAD(P)H; blue indicates oxidised regions, with high FAD. The central cytosol appears more reduced, while the periphery shows higher oxidative potential.
Individual fluorescence channels. C (FAD) is the oxidised flavoprotein channel, in blue-cyan; D (NAD(P)H) the reduced pyridine nucleotide channel, in green; E the merged, redox-mapped signal, in red intensity. These images demonstrate how autofluorescence imaging enables non-invasive mapping of metabolic heterogeneity within single cells. Redox gradients may reflect mitochondrial polarisation, oxidative stress or metabolic zonation, all critical in disease progression, ageing or therapy response.
Red blood cell biomarkers, 2018 to 2023
2018. Developed the first computational decision support system that uses dual-channel fluorescence imaging to assess red blood cell membrane fluidity in type 1 diabetes. This work laid the computational foundation for RBC-based diagnostics.
2019. Introduced lipid phase separation as a quantifiable optical marker in red blood cells for early diagnosis and monitoring of type 1 diabetes progression.
2020. Introduced membrane micropolarity as a diagnostic feature to distinguish type 1 (T1DM) from type 2 (T2DM) diabetes, and validated its discriminatory power across heterogeneous patient populations.
2022. Demonstrated that reduced membrane fluidity in red blood cells is associated with diabetic retinopathy in type 1 diabetes, highlighting its role as an early microvascular risk biomarker.
2023. Used fluorescence imaging to show the reorganisation of liquid crystalline domains in red blood cell membranes of type 2 diabetic patients with peripheral artery disease, linking structural changes to macrovascular complications.
2023. Demonstrated that red blood cell fluidity acts as an independent biomarker for residual cardiovascular risk in treated type 2 diabetic patients, potentially reflecting endothelial dysfunction or inflammation.
The full publication list behind this work is on the Publications page.